- Products & services Products & services
- Resources Resources
- Community CommunityDiscussion
- Discussion
- Knowledge
- IdentityIQ wiki Discover crowd sourced information or share your expertise
- IdentityNow wiki Discover crowd sourced information or share your expertise
- File Access Manager wiki Discover crowd sourced information or share your expertise
- Submit an idea Get writing tips curated by SailPoint product managers
Knowledge
- Compass
- :
- Products
- :
- File Access Manager
- :
- File Access Manager Wiki
- :
- Activity/Event Statistics Logs - Explained
- Article History
- Subscribe to RSS Feed
- Mark as New
- Mark as Read
- Bookmark
- Subscribe
- Printer Friendly Page
- Report Content to Moderator
Activity/Event Statistics Logs - Explained
Activity/Event Statistics Logs - Explained
This informational guide is aimed to aid you in understanding what you are looking for in the "-Statistics.log" and assist any troubleshooting.
Applicable Versions: 5.X, 6.0, 6.1
See Event Data Flow and Troubleshooting if needed
In general, you are looking for Event Data movement. High numbers or NO numbers in specific areas may be an indication of an issue.
BAM Statistics
Flow Path: BAM/Activity Monitor > Event Manager > Elasticsearch Search & SQLDB
These logs are typically located on the server containing the BAM (Activity Monitor) Service. See: Where Are The Logs article if needed.
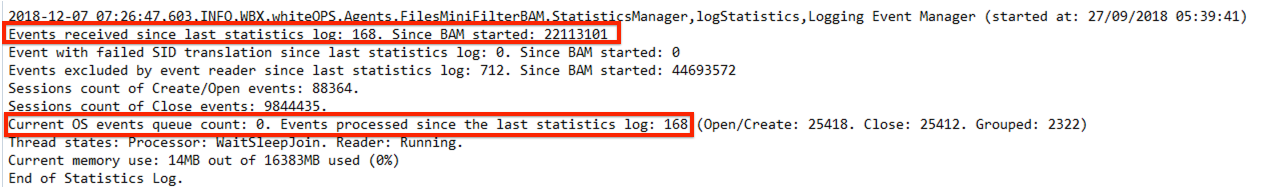
For most targeted applications, the BAM (Activity Monitor) - Statistics.logs have the same information but can differ slightly. Below is an example of a Windows File Server Statistics log
(click to enlarge image).
|
Log Line |
Explanation |
Indicators of Issues |
Things to Try |
|---|---|---|---|
|
Events received since the last statistics log. |
|
Not up to date to the nearest minute. No events received since last statistics log. |
|
| Since BAM Started | This is the total number of events that the BAM has detected | Zero |
|
| Current OS events queue count or Events waiting in Queue |
|
Large Number |
|
| Events Processed since the last statistics log |
|
Zero |
|
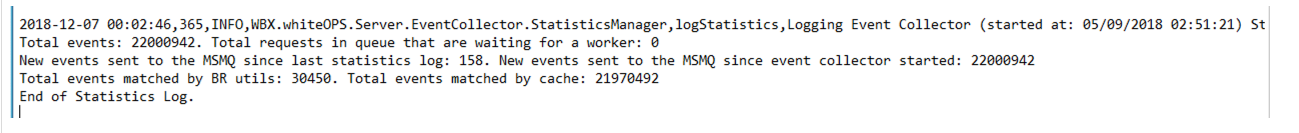
Event Collector Statistics
Flow Path: BAM/Activity Monitor > Event Manager > Elasticsearch Search & SQLDB
Note: The Event Manager is a two-component process. See Event Manager & Event Collector Explained for more details.
(Click to enlarge image)
|
Log Line |
Explanation |
Indicators of Issues |
Things to Try If Issues Indicated |
|---|---|---|---|
| Time | This log is updated every minute | Log time not up to date to the nearest minute |
|
| Total Events | Total Events the Event Collector has picked up from BAMs | Zero |
|
| Total requests in queue waiting for worker: |
That indicates that Events are moving to the Event Manager. This number should be at zero or close to it. |
High Numbers |
|
| New Events sent to MSMQ | Event moving to the Event Manager basically | Zero |
|
| New events sent to the MSMQ since event collector started | Total events sent | Zero |
|
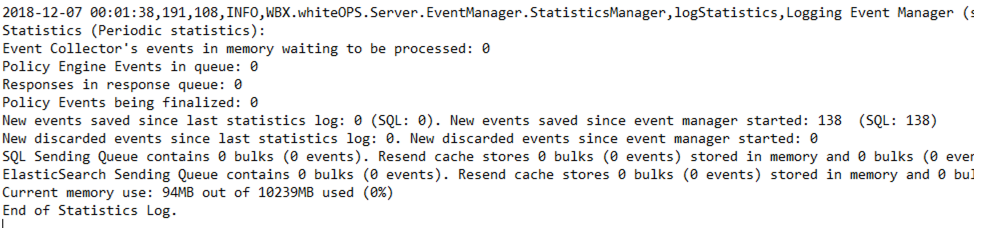
Event Manager Statistics & Event Manager.log
Flow Path: BAM/Activity Monitor > Event Manager > Elasticsearch Search & SQLDB
Note: The Event Manager is a two-component process. See Event Manager & Event Collector Explained for more details.
(Click to enlarge image)
|
Log Line |
Description |
Indicators of Issues |
Things to Try if Issues Indicated |
|---|---|---|---|
| Time | This log is updated every minute | Log time not up to date to the nearest minute |
|
| SQL sending Queue contains # bulks (# events). Resend cache stores # bulks (# events) stored in memory and # buiks (# events) on Hard disk | Events being sent from the Event Manager to the SQL DB. Resend cache |
High Numbers - Events that could not be sent for some reason and are waiting (being stored on the local storage) |
|
| Policy Engine Events in queue | Events that have triggered a response, waiting to be processed | Varies |
|
| New events saved since last statistics log (SQL: ) | How many events have saved as activities in the SQL DB in the last minute | Varies - Meaning if this is a high traffic application and this number is low or zero. This may indicate issues |
|
| New discarded events since last statistics log | Discard rules applied to the application | Varies - This is dependent on your configuration |
|
| Event Collector's events in memory waiting to be proceed |
Events in memory waiting to be proceed This should be zero or really close to it |
High Number |
|
| ElasticSearch Sending Queue contains # bulks (# events). Resend cache stores #bulks (# events) stored in memory and # bulks (# events) on HardDisk | Events being sent from the Event Manager to the Elasticsearch DB. Resend cache |
High Numbers - Events that could not be sent to Elasticsearch for some reason and are waiting (being stored on the local storage). |
|
