- Products & services Products & services
- Resources ResourcesLearning
- Learning
- Identity University Get technical training to ensure a successful implementation
- SailPoint professional certifications & credentials Advance your career or validate your identity security knowledge
- SailPoint recertification program Get recertified by demonstrating ongoing learning
- Training onboarding guide Make of the most of training with our step-by-step guide
- Training FAQs Find answers to common training questions
- Community Community
- Compass
- :
- Products
- :
- File Access Manager
- :
- File Access Manager Wiki
- :
- Activities/event data flow and troubleshooting
- Article History
- Subscribe to RSS Feed
- Mark as New
- Mark as Read
- Bookmark
- Subscribe
- Printer Friendly Page
- Report Content to Moderator
Activities/event data flow and troubleshooting
Activities/event data flow and troubleshooting
- Introduction
- Understanding the flow of event data
- Check WebUI and admin console
- Targeted EndPoint and activity monitor
- Event manager
- Elasticsearch DB
- Microsoft SQL Server DB (MSSQLDB)
Introduction
This informational guide is to provide a high-level insight into the "Event Data Flow Path" as a whole and try and provide some troubleshooting steps.
Applicable Version(s): 5.X, 6.0, 6.1, 8.0, 8.1
Common Scenario: Activities no longer showing in the WebUI (6.0 and higher) or in the Admin Console (5.X)
Understanding the flow of event data
Flow Path: Targeted EndPoint > BAM > Event Manager > Elasticsearch Search & SQLDB
For more information related activity monitoring, refer to the "Activities" section of the File Access Manager Administrator Guide
For an in depth understanding of Activity monitoring in FAM, refer to this article FAM Activity Monitoring - Explained.

Check WebUI and admin console
Depending on the version you are running,
- WebUI - 6.0 and above.
- Admin Console - 5.X and below.
Check for recent activities from the endpoint(s). Hint: Run the activity forensics for the last 1 hour. If they appear then all is OK.
But that's probably not why you are here. Read below.
Targeted EndPoint and activity monitor
1. Is this endpoint up and running?
2. Is the Activity Monitor service running? Try stopping and starting the service.

Note: Some applications (Targeted Endpoints) require that the Activity Monitor be installed ON the targeted endpoint (application).
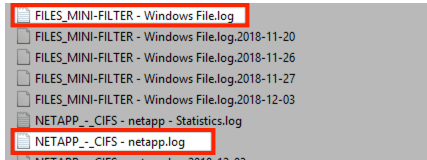
3. Are there any errors in the logs? See: Where are the Logs Article if needed.
Note: Depending on the Application (Targeted Endpoint) the names of this log files will differ. The screenshot below shows Windows File Server. Notice and how they differ from NetApp.

4. Are Events moving?
Note: You will need to check the " - Statistics.log" file. (See: Activity/Event Statistics Logs - Explained)
5. If events appear to move to the Event Manager, check the logs and statistics of the Event Manager. Also, see: FAM Activity Monitoring - Explained if needed.
Event manager
The Event Manager has two moving parts in one. Again, please see FAM Activity Monitoring - Explained, or see the "Activities" section of the File Access Manager Administrator guide.
1. Are events moving from the BAM(s) to the Event Collector?
- Check statistics logs (see the Event Collector section: Activity/Event Statistics Logs - Explained)
2. If Statistics logs look ok, check Event Manager.
3. Are events moving from the Event Manager to the ElasticsearchDB?
- Check statistics logs (see the Event Manager section: Activity/Event Statistics Logs - Explained)
4. Are events moving from the Event Manager to the SQL Server database?
- Check statistics logs (see the Event Manager section: Activity/Event Statistics Logs - Explained)
If you have navigated this far. Usually, this is the last stop and indicator of the problem may be residing in the ElasticsearchDB or with the SQL Server database.
Elasticsearch DB
Most commonly, this is due to the following:
- Lack of Discard Rules
- Lack of Exclusion Rules
- Lack of Event Removal
View the article located here may assist you further: Elasticsearch DB Full or Almost There
Microsoft SQL Server DB (MSSQLDB)
Most commonly, this is due to large amounts of events taking space or the DB Cleanup task (which is scheduled to auto run daily) has been disabled for some reason. Along with running out of disk space.
You can refer to the same article mentioned above which may aid you, Elasticsearch DB Full or Almost There
- Mark as Read
- Mark as New
- Bookmark
- Permalink
- Report Content to Moderator
I think the idea to save a copy of event in SecurityIQ DB for backup is a bad idea if in case we need to re-built the Elastic Search server from scratch.
Why can't we use the backup and restore API of Elastic search for the same? It will also increase the performance of Event Manager server and database space.
- Mark as Read
- Mark as New
- Bookmark
- Permalink
- Report Content to Moderator
the links on this page, don't work for me, they all just say
This site can’t be reached
docs’s DNS address could not be found. Diagnosing the problem

