- Products & services Products & services
- Resources ResourcesCustomer resources
- Customer resources
- Customer support Find more information about engaging support and get help
- Services guide Find more information about working with Services teams
- Free resources Leverage our free tools and trainings
- Modernize to Identity Security Cloud Transition to the cloud for advanced capabilities and a future-ready security posture
Learning- Learning
- Identity University Get technical training to ensure a successful implementation
- SailPoint professional certifications & credentials Advance your career or validate your identity security knowledge
- SailPoint recertification program Get recertified by demonstrating ongoing learning
- Training onboarding guide Make of the most of training with our step-by-step guide
- Training FAQs Find answers to common training questions
- Community Community
- Compass
- :
- Products
- :
- File Access Manager
- :
- File Access Manager Wiki
- :
- How To Change Logging Modes
- Article History
- Subscribe to RSS Feed
- Bookmark
- Subscribe
- Printer Friendly Page
- Report Content to Moderator
How To Change Logging Modes
How To Change Logging Modes
This doc will guide you in changing Logging Modes from Errors Only, DEBUG and Info.
There are 2 way that you can change logging levels.
- Health Center
- .exe.config File
Health Center Log Change
- Log into the SIQ Admin Client
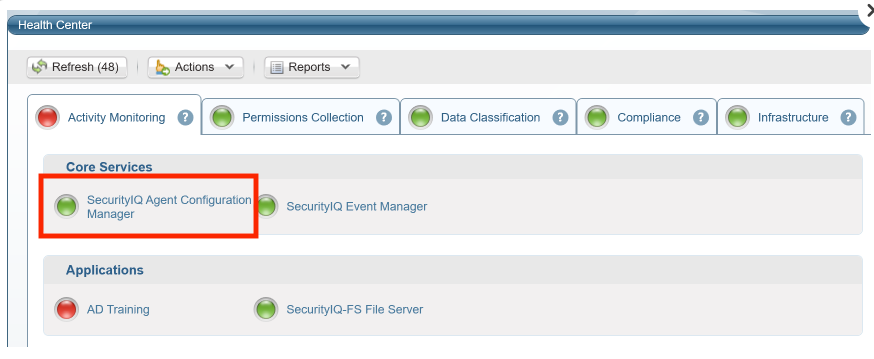
- Navigate to the Health Center in the left-hand panel.
- In the Health Center menu, locate the name Service that you are needing to inspect/troubleshoot. (Note: SecurityIQ Agent Configuration Manager will be used for this scenario)Click the Actions drop down.
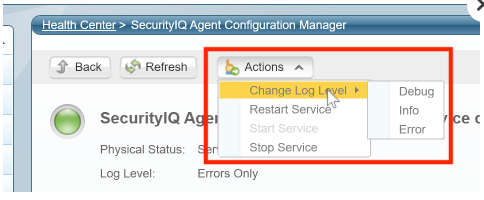
- Click the Actions drop down.
- Change Log Level and select which Logging Mode you would like to use. You do not have to restart the service and now the service will begin logging to the mode you selected.

Changing the logs via the .exe.config File
- This method should be used if the Health Center log change method does not work for some reason or the Service(s) you are trying to troubleshoot does not have this option such as Activity Monitors. Please note, not all services have the .config file (ie. Elasticsearch).
- Not every customer's environment is the same file structure. For the example below, the C drive will be the use case.
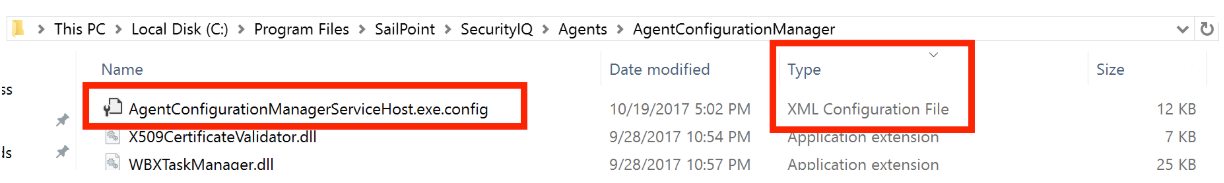
- Navigate to C:\Program Files\SailPoint\SecurityIQ.
- This is where the majority of the Services live. You will need to open the folder that contains the Service/Agent that you are looking for. Note: Agent Configuration Manager will still be used for this scenario.
- Once you are inside the desired Service/Agent folder click the Type filter option near the top Windows File Explorer panel until XML Configuration File is at the top (see screenshot below for reference).
- Right-click the .exe.config file and select Edit with and choose either Notepad++ or the built-in Windows Notepad.
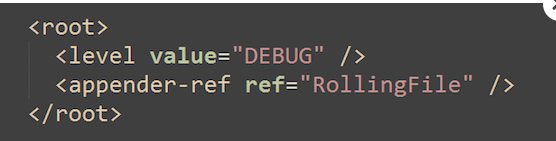
- You will need to edit the <root> level value (see screenshot below for reference). You can change this to ERROR, DEBUG or INFO. You need to use ALL CAPS. For the most part, your will either be using ERROR or DEBUG. Be sure to change the logs back to ERROR when any troubleshooting is completed. Staying in DEBUG mode can create large files. With this activated, you can run tasks or troubleshooting to generate the appropriate logs.
-
ERROR DEBUG 
-
- With this activated, you can run tasks or troubleshooting to generate the appropriate logs.
- IMPORTANT: Be sure to revert back to ERROR mode once logs have been collected as this will take up disk space and may cause task(s) to slow down since more in-depth logging is taking place.
Increasing The Number of Logs Collected
There are times when troubleshooting and debugging where you may be asked to increase the logs being collected. Below is how you do this.
In this example, we will be increasing the number of logs collected for the Data Classification service. Note: Each service has its own config file that can be edited in and is generally in the same format.
- Navigate to the .config file location. Default location, C: Drive > Program Files > SailPoint > SecurityIQ > Name of Service.
- Locate the ".exe.config" file, right-click open with NotePad or NotePad++.

3. Once you are in the edit view inside the config file, scroll down until you see the following key, <maxSizeRollBackups> within the "RollingFile " key. Note: The default value is 0 (zero). However, this means that only 1 log file will be generated, which is the default.

4. Depending on what type of issues you are encountering and trying to troubleshoot can help you determine how many log files you want to allow to be generated. For our example for Data Classification, we will increase this to 5 just to be safe. What this means is, a maximum of 5 logs files in of 30MB in size will be allowed to be generated.

5. Manually start and stop the services for these changes to take effect.
Adjusting Logging Level For Elasticsearch
- Please this Compass article for more details on adjusting the Elasticsearch logging: https://community.sailpoint.com/t5/File-Access-Manager-Documents/Adjusting-Logging-Levels-in-Elastic...
8.2 Logging Update
As of 8.2 File Access Manager no longer using the Log4Net logging system but rather NLog.
More information about NLog and its keys can be found here: https://nlog-project.org/documentation/v4.3.0/html/Properties_T_NLog_Targets_FileTarget.htm
Do not attempt to add keys to the NLog.config file unless directed by Engineering.
Note: Central Permission Collection - CPC 1 will be the example for the below steps.
Changing from ERROR to DEBUG
To change the service's logging level...
- Navigate to the Service's root folder.
Note: Your drive my differ depending on the location of where initially installed the File Access Manager Service - Open the NLog.config with Notepad or a preferreed text editor
- Change minlevel="ERROR" to "DEBUG"
- Save the file, restart the service

Increasing the Amount of Logs Collected
These setting are also located in the NLog.config file.
maxArchiveFiles="10"The default is currently set to 10 log files that will be kept.
archiveAboveSize="31457280"This sets the size in bytes, this is approx. 31 MB.

Special Note
The logs will eventually auto remove themselves from the Logs folder on their respective services after 15 days. This is can be changed from the below table and Row name.
select * from whiteops.system_configuration_value
where name like '%Log Files Expiration Days%'
This applies for previous versions to 8.2
