- Products & services Products & services
- Resources ResourcesLearning
- Learning
- Identity University Get technical training to ensure a successful implementation
- SailPoint professional certifications & credentials Advance your career or validate your identity security knowledge
- SailPoint recertification program Get recertified by demonstrating ongoing learning
- Training onboarding guide Make of the most of training with our step-by-step guide
- Training FAQs Find answers to common training questions
- Community Community
- Compass
- :
- Discuss
- :
- Community Wiki
- :
- IdentityIQ Wiki
- :
- IdentityIQ and Splunk
- Article History
- Subscribe to RSS Feed
- Mark as New
- Mark as Read
- Bookmark
- Subscribe
- Printer Friendly Page
- Report Content to Moderator
IdentityIQ and Splunk
IdentityIQ and Splunk
- Overview
- Step 1: Get SplunkD
- Option 1: IdentityIQ Log Files
- Option 2: Splunk DBConnect
- SplunkDB DB Connect configuration
- Searching the logs
Overview
Splunk is a third party tool that captures, indexes, and correlates real-time data in a searchable repository from which it can generate graphs, reports, alerts, dashboards, and visualizations.
Step 1: Get SplunkD
You have some options when it comes to integrating IdentityIQ with Splunk and it mainly centers around what information from IdentityIQ you want to see in Spunk. Your options are:
1. Point Splunk to the IdentityIQ Log Files
2. Using SplunkDB Connect point Splunk to specific IdentityIQ DB Tables.
So which one should you choose. Well it depends. How have you configured your IdentityIQ installation? What type of data are you looking for? If you've heavily invested into log4j by making specific log4j files for different events, and you are looking for "Application administration" type data (i.e Task failures, code exceptions, etc). Than easiest thing is to just point Splunk to your log files. If you are looking for Audit specific data then you'll need to point Splunk to the Audit tables within IdentityIQ, thus using the Splunk DB Connect App.
Option 1: IdentityIQ Log Files
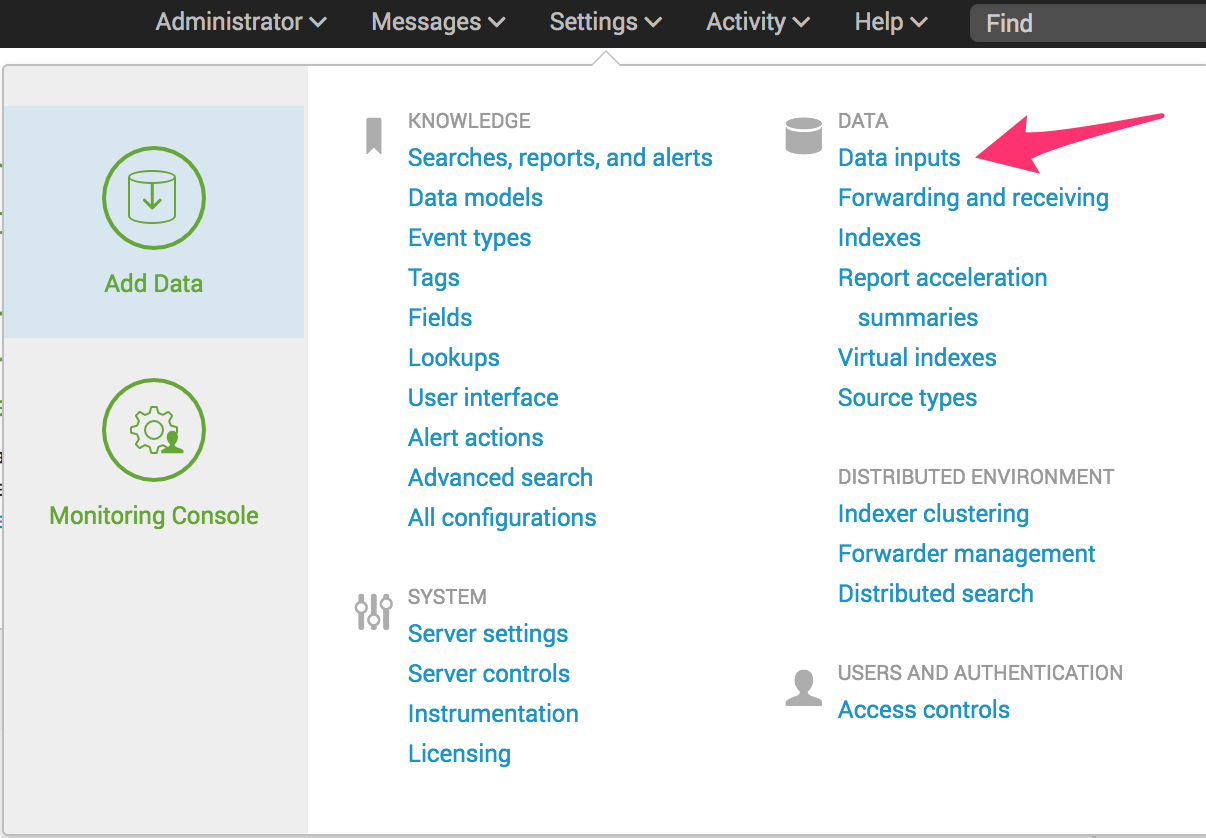
I won't go over this option in great detail, as it's fairly straightforward and should only take you a couple of minutes to get up and running. First after logging into your Splunk Dashboard, select Data Inputs

After that you want to select the Files and Directories option. When specifying the directory, the quickest option is just to point to the application server logs directory (with log4j configured, you can alternatively point to the specific log4j files to eliminate all the white noise from the other application server logs):

As you can see pointing to log files is pretty easy to do in Splunk, so I'll leave you to Google and the interwebs for any further questions on this.
Option 2: Splunk DBConnect
Ok so first thing you need to do is download the SPlunk DB Connect App. You can do that here: Splunk DB Connect | Splunkbase ( Disclaimer: That app is built by Splunk, runs on Splunk's platform, and is used by Splunk...Are you seeing a pattern here? So if you have problems with that app.....contact Splunk).
SplunkDB DB Connect configuration
The documentation around connecting and configuring SplunkDB Connect is fairly in depth, so instead of reinventing the wheel I'll just point you to the goods: About Splunk DB Connect - Splunk Documentation
From a high level you can go to the Splunk App Store to add the DB Connect add-on:

(Note: Since I've already installed it the button states Open App, if it is not installed it will state Install).
After that you want to add the database drivers for DB Connect into the $SPLUNK_HOME/etc/apps/splunk_app_db_connect/drivers.
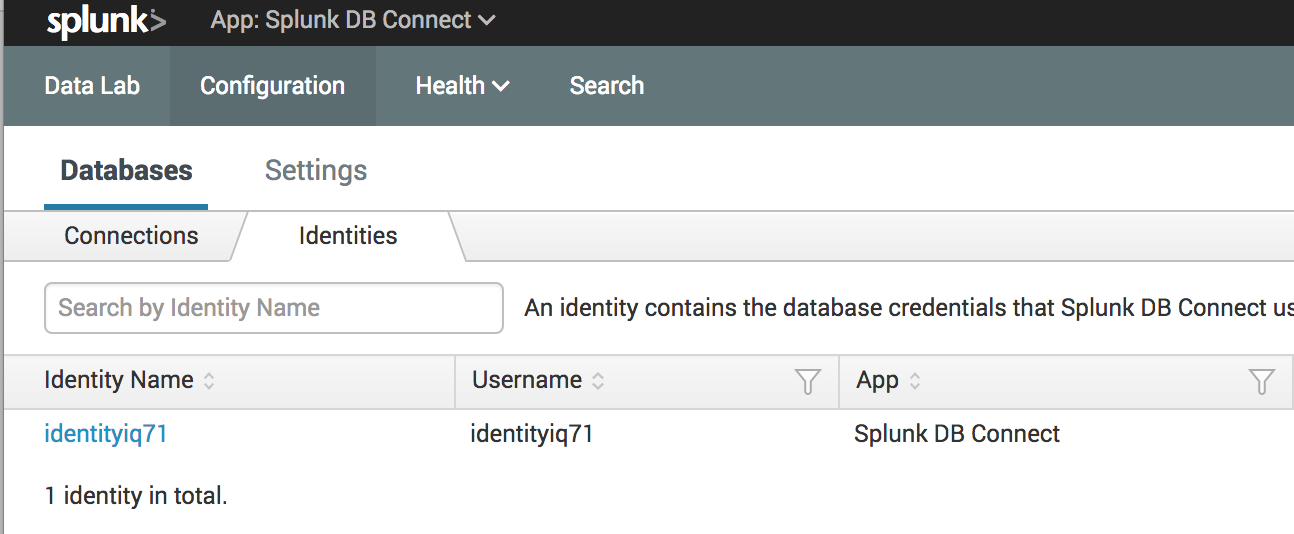
Now that you have SpunkDB Connect setup, you want to navigate to the Configuration -> Databases -> Identities Tab and add the admin credentials to connect to your IIQ database.

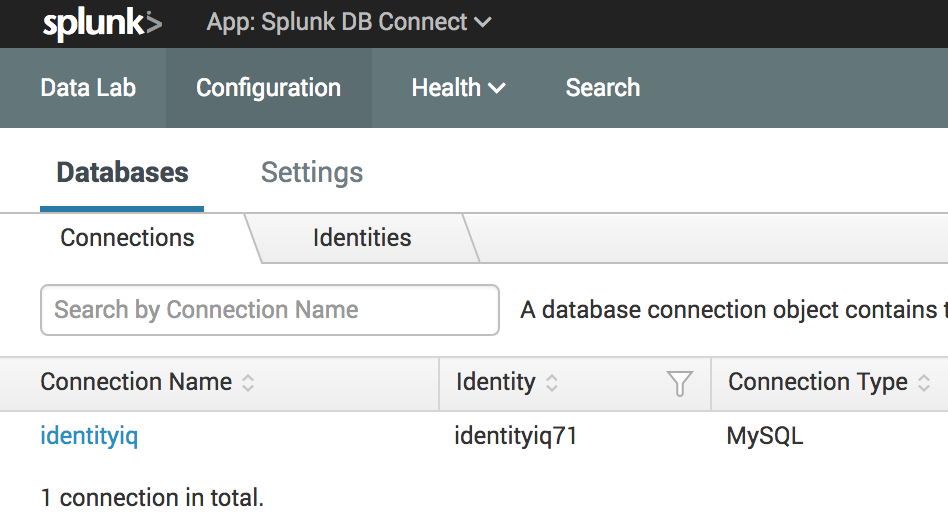
Next, navigate to the Connections tab and add your IIQ database.

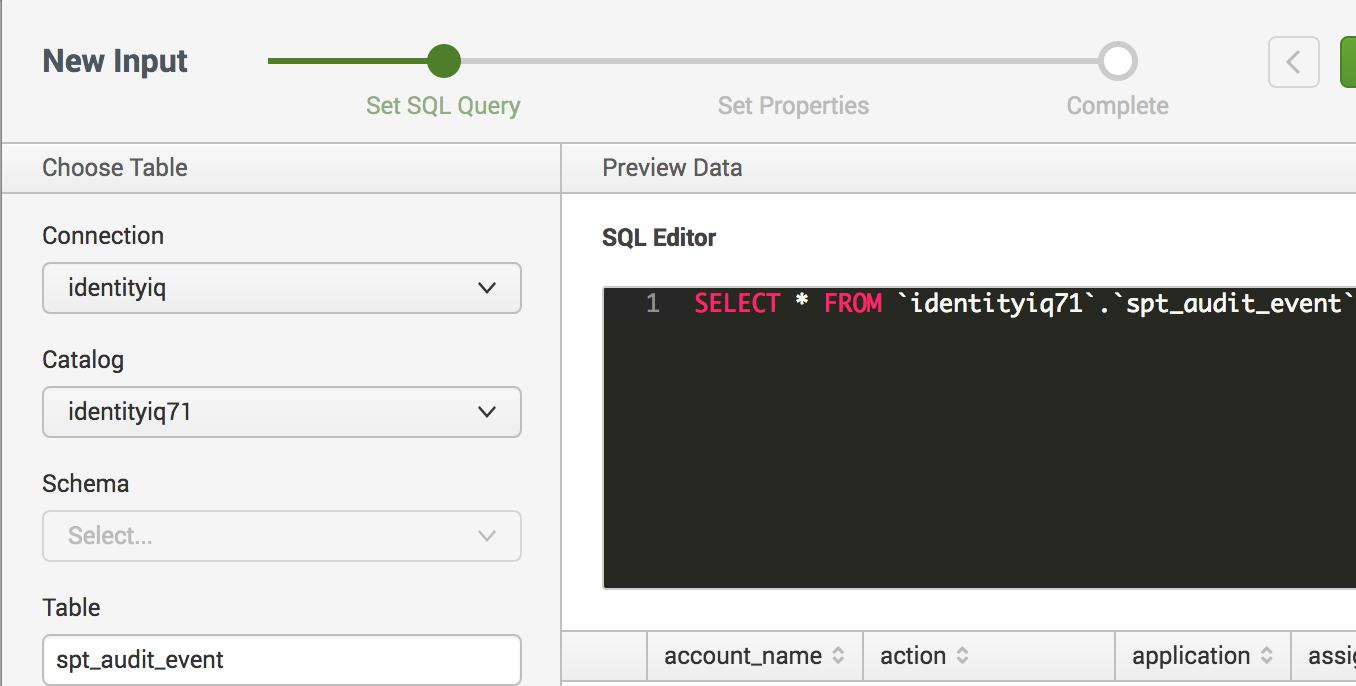
Now we select the tables that we want Splunk to search. We do this by using the Connection, Catalog, Schema, and Table options on the left hand side of the screen. The good thing is that as you select values, the app will automatically query the database for the others, allowing you to browse for the data you want. In the screenshot below we are going to select the spt_audit table. Once you select the table, the app will generate and send a query giving you an example of the data.

Last step here, give the input a name, time to run, and metadata information so we can save our new input.
Searching the logs
Ok, so now our setup is finished and we have a shiny new source just waiting to be Splunked. Once you save your new input, you'll be taken back to the Data Lab home screen. From there you will see your list of Inputs, with the name of your recently created input highlighted in blue. To the far right under the Actions header you'll find 4 clickable actions.
1. Edit
2. Clone
3. Find Events
4. Delete
When you click the Find Events link it will run your input query and send you to the Splunk Search screen. You will now be able to do all the Splunk goodness your heart desires against the IdentityIQ audit data
- Mark as Read
- Mark as New
- Bookmark
- Permalink
- Report Content to Moderator
Very helpful post, I did use option 1 once, was not aware of option 2. Thanks,
- Mark as Read
- Mark as New
- Bookmark
- Permalink
- Report Content to Moderator
Hello jom.john,
We have also integrated with Splunk and it is definitely a great tool for monitoring and alerting perspective. We are currently using a query to find out the provisioning failures and we are able to successfully get the data and display in interactive charts and tables. If you have something similar and that you are using to get data from the databases and using it for monitoring and alerting purposes please post it here as it would be a great help. Below is the query I am using:
Query
---------
Select DATEADD(hour,-5,DATEADD(s, CREATED/1000 , '1970-01-01 00:00:00')) as Created_Date,
SOURCE as Source_Identity,
ACTION as Action,
TARGET as Target_identity,
APPLICATION as Application_Name,
ACCOUNT_NAME as Account_Name,
INSTANCE as Instance,
ATTRIBUTE_NAME as Attribute_Name,
LEFT(CAST(attribute_value AS NVARCHAR(256)), 256) as Attribute_Value,
ATTRIBUTES as Attributes,
interface as IIQ_Interface
FROM "IdentityIQ"."identityiq"."spt_audit_event"
WHERE (ACTION='ProvisioningComplete' or ACTION='ProvisioningFailure')
Do let me know.
Thanks!
Sumit Gupta
- Mark as Read
- Mark as New
- Bookmark
- Permalink
- Report Content to Moderator
It will vary based on the database you're connecting to. For my local instance, I just use MySQL over the default port, so the JDBC url was: jdbc:mysql://localhost:3306/identityiq
- Mark as Read
- Mark as New
- Bookmark
- Permalink
- Report Content to Moderator
There also seems to be a Splunk add-on called "SailPoint Adaptive Response". Does anyone have experience of integrating this with IIQ?
- Mark as Read
- Mark as New
- Bookmark
- Permalink
- Report Content to Moderator
Hi @martin_sandren - We are trying to use "SailPoint Adaptive Response", but stuck at a point were we know we are connected to SailPoint, but seeing no results on Splunk side. Couldn't find much help guide on SailPoint, so just left it there for now and planning to pick it back up when we have room for it. Let us know if you were successful in implementing it and the steps you followed to implement.
Thanks,
Akash
- Mark as Read
- Mark as New
- Bookmark
- Permalink
- Report Content to Moderator
We used a different approach for the integration and it now works fine.
Feel free to reach out to me on LinkedIn and I will connect you with my architect.

