SailPoint Identity Security Cloud AuditEvent Add-on for Splunk - Installation and User Guide
SailPoint's Identity Security Cloud AuditEvent Add-on has been certified by Splunk and is designed to provide customers the ability to extract audit information from one of their Identity Security Cloud tenant using Splunk Enterprise or Splunk Cloud.
Using Identity Security Cloud's AuditEvents API, we can solve a number of problems with this add-on. Some examples include:
- Surface and gain insights into the brute force password attempts Identity Security Cloud has blocked
- Correlate Identity Security Cloud user activity with other system events to identify coordinated attacks
- Evaluate the timing of login attempts from different geographies to identify problems
For more information about the /search API used by the add-on, see https://developer.sailpoint.com/idn/api/v3.
NOTE: This add-on is intended to make it even easier to bring Identity Security Cloud user activity and governance events into Splunk to improve insights from your security incident and event monitoring solution. But if you already have a Splunk integration that's working for you, you don't need to make any changes or switch to this option.
NOTE: The Splunk add-on does not interact with the virtual appliance and is an add-on for your existing Splunk deployment. Please refer to your Splunk Administrator for network permissions/needs.
- Architecture
- Identity Security Cloud
- Authentication
- AuditEvents
- Splunk Enterprise/Splunk Cloud
- Events
- SourceTypes
- Data Input
- Add-on
- Requirements
- SailPoint Identity Security Cloud
- Splunk
- Installation
- Generating a Personal Access Token (PAT) in Identity Security Cloud
- What is a Personal Access Token?
- Downloading and installing the add-on from SplunkBase
- Downloading and Installing from SplunkCloud App Browser
- Special Installation Considerations
- Installation on Search Head Clusters
- Installation via Deployment Server
- Installation on Heavy Forwarders
- Setup
- Add-on settings
- Creating Identity Security Cloud data input
- Setting the interval time appropriately
- Proxy Settings
- User Guide
- Searching on Source Type
- Advanced Search
- Dashboard
- Index Setting:
- Related Links
- Version 2 Updates - 12/2/2019
- 1/15/2020
- 10/14/2020
- 01/08/2021
- 04/12/2021
- 04/27/2021
- 10/06/2021
- 11/04/2021
- 03/24/2021
- 08/17/2023
- 11/09/2023
- 06/27/2024
- 08/23/2024
- 10/25/2024
- 02/07/2025
Architecture
Identity Security Cloud
Authentication
The Splunk Add-on for Identity Security Cloud authenticates to the cloud tenant twice, once to be issued a JSON Web Token (JWT) by the API gateway, and again using this JWT when retrieving the actual AuditEvent records from ISC. The initial request requires that the add-on be configured with a Client ID,Client Secret issued by the ISC tenant, where the 'ClientID' and 'Client Secret' are attained by creating a Personal Access Token in Identity Security Cloud (Best Practices - IdentityNow REST API Authentication). It is recommended that when using the 'client_credentials' mechanism with a Personal Access Token, that a service account is created in Identity Security Cloud for this process. These credentials are saved on the 'Data Input' in Splunk, which allows a single installation of the add-on to be used across all tenants owned by an organization. The credentials are then utilized to retrieve a JSON web token (JWT) from the ISC tenant. If the JWT is not issued due to error, the script will exit. Once a valid JWT is issued by IdentityNow, the add-on script will then make a POST request to /v3/search/events, using 'Bearer' authentication and this JWT token.
AuditEvents
AuditEvents in Identity Security Cloud represent "things of interest" that occur during the normal day to day operations of ISC. These include events such as an admin creating/deleting applications, successful authentications, provisioning failures, etc. Identity Security Cloud has built-in reporting capabilities to review these events, but the /search API can be used to extract these events for further examination externally. Currently, each event extracted via the API has the following JSON format:
{
        "org": "org_name",
        "pod": "stg01-uswest2",
        "created": "2019-09-13T23:29:37.097Z",
        "id": "ffd69f6f-c3bc-4dbf-89cf-f4d7f91834bb",
        "action": "AUTHENTICATION-103",
        "type": "AUTH",
        "actor": {
            "name": "Adam.Kennedy"
        },
        "target": {
            "name": "Adam.Kennedy"
        },
        "stack": "oathkeeper",
        "trackingNumber": "748e1adb8fa94cda8f5b054e869c24cd",
        "ipAddress": "207.189.160.209",
        "details": "748e1adb8fa94cda8f5b054e869c24cd",
        "attributes": {
            "pod": "stg01-uswest2",
            "org": "org_name",
            "sourceName": "SailPoint",
            "info": "LOGIN_SUCCESS"
        },
        "objects": [
            "AUTHENTICATION"
        ],
        "operation": "REQUEST",
        "status": "PASSED",
        "technicalName": "AUTHENTICATION_REQUEST_PASSED",
        "name": "Request Authentication Passed",
        "synced": "2019-09-13T23:29:38.428Z"
    },
Splunk Enterprise/Splunk Cloud
Events
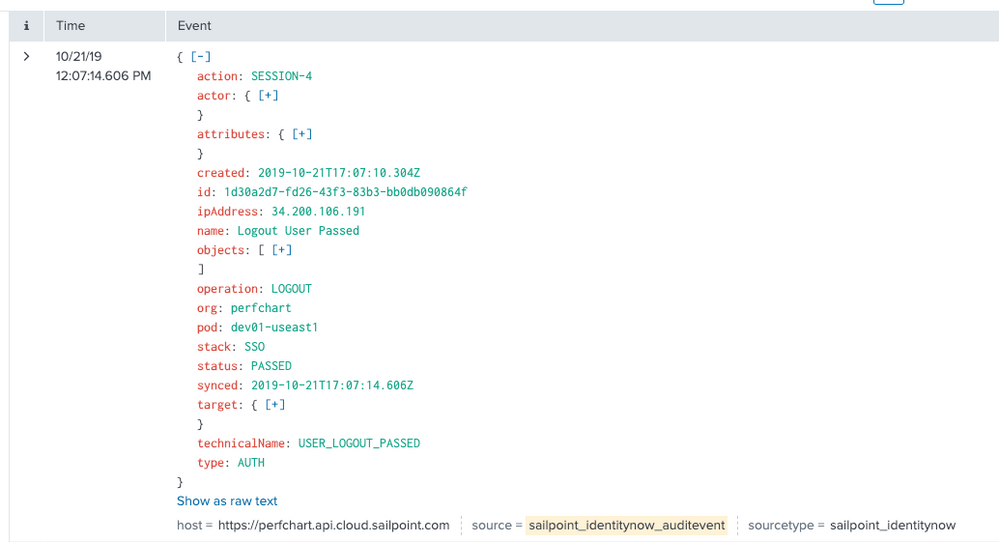
An event is a single piece of data in Splunk software, similar to a record in a log file or other data input. When data is indexed, it is divided into individual events. Each event is given a timestamp, host, source, and source type. Often, a single event corresponds to a single line in your inputs, but some inputs (for example, XML logs) have multi-line events, and some inputs have multiple events on a single line. When you run a successful search, you get back events. Similar events can be categorized together with event types. The following image shows what an Identity Security Cloud audit event looks like as a Splunk event:
SourceTypes
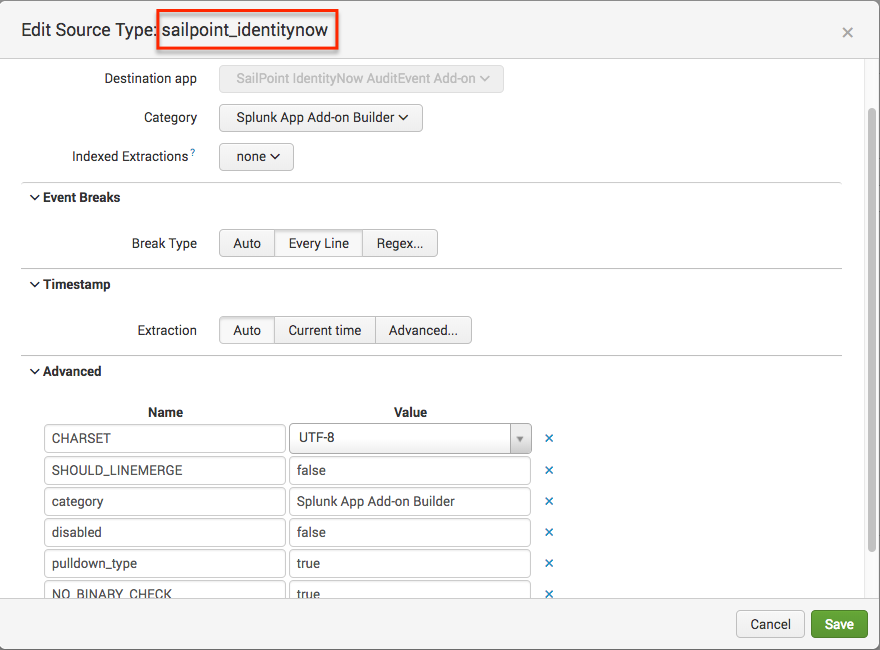
Source type is a default field that identifies the data structure of an event. A source type determines how Splunk Enterprise formats the data during the indexing process. Splunk Enterprise comes with a large set of predefined source types, and it assigns a source type to your data. You can override this assignment by assigning an existing source type or creating a custom source type. This add-on creates a custom source type 'sailpoint_identitynow'. The Splunk indexer identifies and adds the source type field when it indexes the data. As a result, each indexed event has a source type field. A Splunk admin can use the source type field in searches to find all data of a certain type (as opposed to all data from a certain source). The 'sailpoint_identitynow' source type is straightforward, as seen here:
Data Input
A Splunk deployment typically has three processing tiers: data input, indexing, and search management. A specific input consumes a raw data stream from its source (broken into 64k blocks) and annotates each block with some additional metadata (host, source, and source type). Splunk does not look at the contents of the data stream at this point, so the metadata is consistent across all data in a single stream. After raw stream input, the next thing that occurs is the data is parsed into individual events. The ISC add-on creates the events as part of the included scripts. Single data-input exists for the given sourcetype with the ability for the data input to specify execution interval. The ISC add-on defaults the data input interval to 300 seconds (5 minutes).
This input executes a Python script to make HTTP requests to the correct Identity Security Cloud api gateway endpoints, and gather the audit events. In order for this to work, Identity Security Cloud AuditEvent input much be configured to supply the organization name, a client id, a client secret, a username and a password. Details on the setup and configuration of the data inputs can be found in the 'Setup' section of this document.
Add-on
An add-on is type of app that runs on the Splunk platform and provides specific capabilities to other apps, such as getting data in, mapping data, or providing saved searches and macros. An add-on is not typically run as a standalone app. Instead, an add-on is a reusable component that supports other apps across a number of different use cases. Add-ons can be installed via SplunkBase in the case of Splunk Enterprise and Splunk Cloud, or directly via the local filesystem for Splunk Enterprise. The IdentityNow add-on should be installed via SplunkBase.
Requirements
SailPoint Identity Security Cloud
In order to stream AuditEvent data to a Splunk Enterprise, or Splunk Cloud deployment, an active Identity Security Cloud tenant must exist. Configuration requires that the implementer also have the organization name of their Identity Security Cloud API gateway supporting version 3 of the ISC API's. A client id and client secret generated by requesting a Personal Access Token from Identity Security Cloud are required by the /search API in ISC. Instructions for generating these values can be found in the 'Installation' section of this document.
Splunk
The add-on must be installed in a fully licensed deployment of either Splunk Enterprise, or Splunk Cloud.
Installation
Full installation of the Identity Security Cloud AuditEvent add-on requires minimal configuration in both Identity Security Cloud, and Splunk.
Generating a Personal Access Token (PAT) in Identity Security Cloud
What is a Personal Access Token?
The easiest way to think of a personal access token, is a special OAuth 2.0 client credential tied to a specific user, which as such it gives the same context as the user, without having to give out that user's credentials.
Currently, the way to generate a personal access token, is via the REST API. In order to create a personal access token we'll refer to this documentation: Create Personal Access Token
Personal Access Token creation is a one-time generated token. It can then be used in configurations, in lieu of a password, to operate in a user's context.
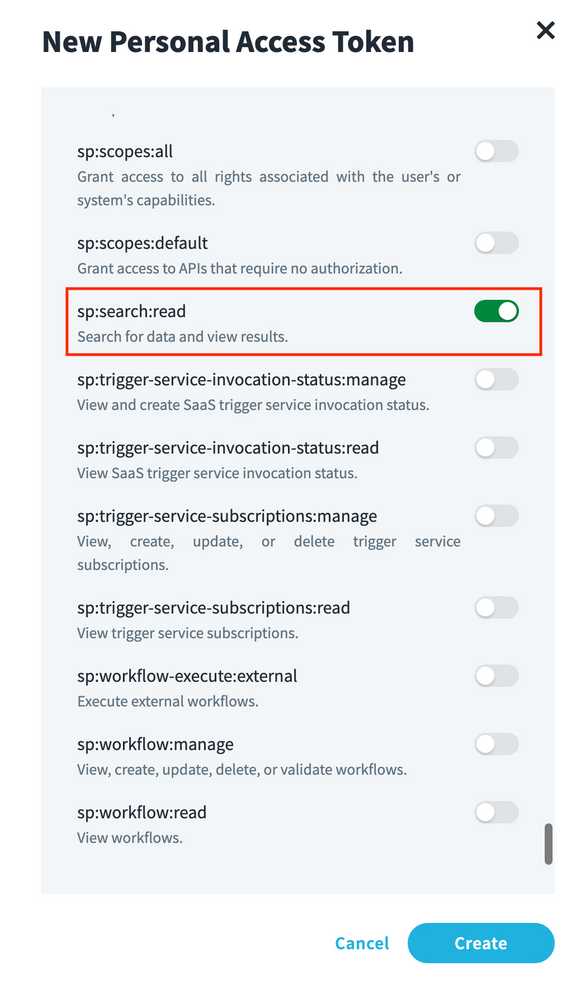
SCOPE: Kindly select sp:search:read as shown in below screenshot when creating personal access token.
More information on scope assignment can be found at: https://developer.sailpoint.com/idn/api/authorization#assigning-scopes-with-the-api
An example call might look like this:
curl -X POST \
  https://example.api.identitynow.com/beta/personal-access-tokens \
  -H 'Authorization: Bearer eyJh...dJ94' \
  -H 'Content-Type: application/json' \
  -H 'cache-control: no-cache' \
  -d '{
	"name": "My Integration"
}'
If successful, a JSON object representing the created Personal Access Token object will be given as a response. For example:
- HTTP 201 Created
- Content-Type: application/json
{
    "id": "86f1dc6fe8f54414950454cbb11278fa",
    "name": "My Integration",
    "secret": "d2be94f1fb61d0a1c63fa78ba941776e21ac6b674808db24d6426839ed758091",
    "created": "2019-11-11T21:04:38.203Z",
    "owner": {
        "type": "IDENTITY",
        "id": "ff80818155fe8c080155fe8d925b0316",
        "name": "slpt.services"
    }
}
Note: This is the only time the Personal Access Tokens' secret attribute will be displayed. Take note for future use.
Once we have the Personal Access Token's id and secret value, we can leverage those in a standard OAuth 2.0 client credential grant flow.
*Important* - The next step in the process is to use these values to retrieve an access token, and the use this token to retrieve a Personal Access Token - refer to Best Practices - IdentityNow REST API Authentication for additional details. The Personal Access Token 'id' and 'secret' will be used in the Splunk app in the 'client id' and 'client secret' fields.
Downloading and installing the add-on from SplunkBase
1. Go to SailPoint Identity Security Cloud AuditEvent Add-on | Splunkbase
2. Click Download, license agreements will be displayed.
3. Verify that the SailPoint Identity Security Cloud AuditEvent Add-on now appears on the main Splunk Dashboard.
Downloading and Installing from SplunkCloud App Browser
1. From within the Splunk instance, navigate to the App Browser by either:
- Click Find More Apps.
2. On the Browse More Apps page, type identity security cloud into the search box.
3. Click the Install button next to the SailPoint Identity Security Cloud AuditEvent Addon.
4. Verify that the SailPoint Identity Security Cloud AuditEvent Add-on now appears on the main Splunk Dashboard.
Special Installation Considerations
The Identity Security Cloud AuditEvent add-on is designed to be used for data collection. It serves to purpose of creating a pre-defined source type for Splunk administrators to easily pull audit data from an Identity Security Cloud tenant into Splunk. As with any Splunk add-on, there are deployment limitations that should be considered based on your organizations specific Splunk architecture.
Installation on Search Head Clusters
Per Splunk's documentation, while add-ons can technically be installed onto hosts designated as 'Search Head's' for search time functionality, it is not recommended that data inputs be configured on 'Search Heads'. Please refer to Splunk's documentation for additional details. Splunk Documentation - About installing Splunk add-ons - Splunk Documentation
Splunk documentation also outlines modifications that are required to install add-ons successfully on search head clusters:
"Before deploying an add-on to a search head cluster, check the documentation of the add-on to ensure it is supported on search head clusters. The add-on documentation might also include pre-deployment steps that you must perform in order to avoid validation errors. The files that cause the validation errors are all irrelevant to search head functionality, but the validation errors prevent deployment.
Unless otherwise instructed in the documentation for the specific add-on, before deploying an add-on to a search head cluster, make the following changes to the add-on package:
- Remove the
eventgen.conffiles and all files in thesamplesfolder. - Remove the
inputs.confandinputs.conf.specfiles, if the add-on contains them. Exception: If you are collecting data locally from the machines running your search head nodes, keep these files. - Remove the
database.conffile, if the add-on contains one."
Link to documentation - Install an add-on in a distributed Splunk Enterprise deployment - Splunk Documentation
The Identity Security Cloud AuditEvent add-on contains both inputs.conf, and inputs.conf.spec files in its build directory. In environments where manual installation of add-ons is not available (unassisted Splunk Cloud), the manual removal of these files to pass validation for search head cluster installation is not possible. Because of these limitations, deploying the SailPoint Identity Security Cloud AuditEvent add-on is currently not supported on Search Head Clusters.
Installation via Deployment Server
Splunk documentation notes:
"If the add-on uses modular or scripted inputs to collect data from remote sources, using a deployment server to deploy the configured add-on to multiple forwarders acting as data collectors causes duplication of data. This limitation applies to third-party deployment solutions as well as the deployment server.
You can safely use a deployment server to deploy unconfigured add-ons."
Link - About installing Splunk add-ons - Splunk Documentation
Installation on Heavy Forwarders
Installation on Splunk heavy forwarders should be possible, but has not been tested. Installation should be done manually, due to the limitation of installation of configured data collectors with the deployment server.
Setup
Add-on settings
Once the add-on has been installed, fill in the add-on's global settings information which is used for data input.
- Enter the organization name associated with the Identity Security Cloud tenant.
- Enter the Client ID ('id' field from the Personal Access Token) that was generated in section 'Generating a Personal Access Token (PAT) in Identity Security Cloud' of the 'Installation' instructions in this guide.
- Enter the Client Secret ('secret' field from the Personal Access Token) that was generated in section 'Generating a Personal Access Token (PAT) in Identity Security Cloud' of the 'Installation' instructions in this guide.
- Click 'Save'.
Creating Identity Security Cloud data input
To define a custom data input:
1. Within the Splunk UI, go to Settings > Data > Data Inputs
2. Locate the SailPoint Identity Security Cloud AuditEvent entry in the 'Local inputs' list. Click Add new.
3. The add-on configurations interface will now be displayed.
- Type the name of the data input. Use something descriptive, such as "IdentityNow Production."
- Enter the organization name associated with the IdentityNow tenant.
- Click the More settings checkbox, and then type in the new interval time (in seconds) for the execution of the collection.
Setting the interval time appropriately
The data type 'SailPoint IdentityNow AuditEvent' installed by the add-on should have its initial interval set to 300 seconds, or 5 minutes. This interval determines how frequently to run the audit event data collection from an IdentityNow tenant. Intervals can be tuned appropriately for each instantiation of the data type. It is recommended that individual organizations tune this value based on organizational needs. The more frequently the data collection scripts execute, the more 'real-time' the collection is, but at the expense of potentially putting heavier load on the IdentityNow api gateway and the Splunk application. To modify the interval on data input creation, click the More settings checkbox, and then type in the new interval time (in seconds) for the execution of the collection.
This can also be modified later through the Splunk UI, by navigating to Settings > Data > Data Inputs > SailPoint Identitynow AuditEvent, and the left-clicking on the name of the data input for which the interval needs to be adjusted. Again, the interval will be located under the More settings checkbox.
Proxy Settings
As of version 1.0.5, proxy settings are available in the configuration of the add-on. To enable proxy communications, simply
1. Click the 'SailPoint IdentityNow AuditEvent Add-on' tile on the Splunk main UI screen
2. Click the 'Configuration' tab at the top of the page
3. On the 'Proxy' tab, enter the details required for your proxy server
User Guide
Searching on Source Type
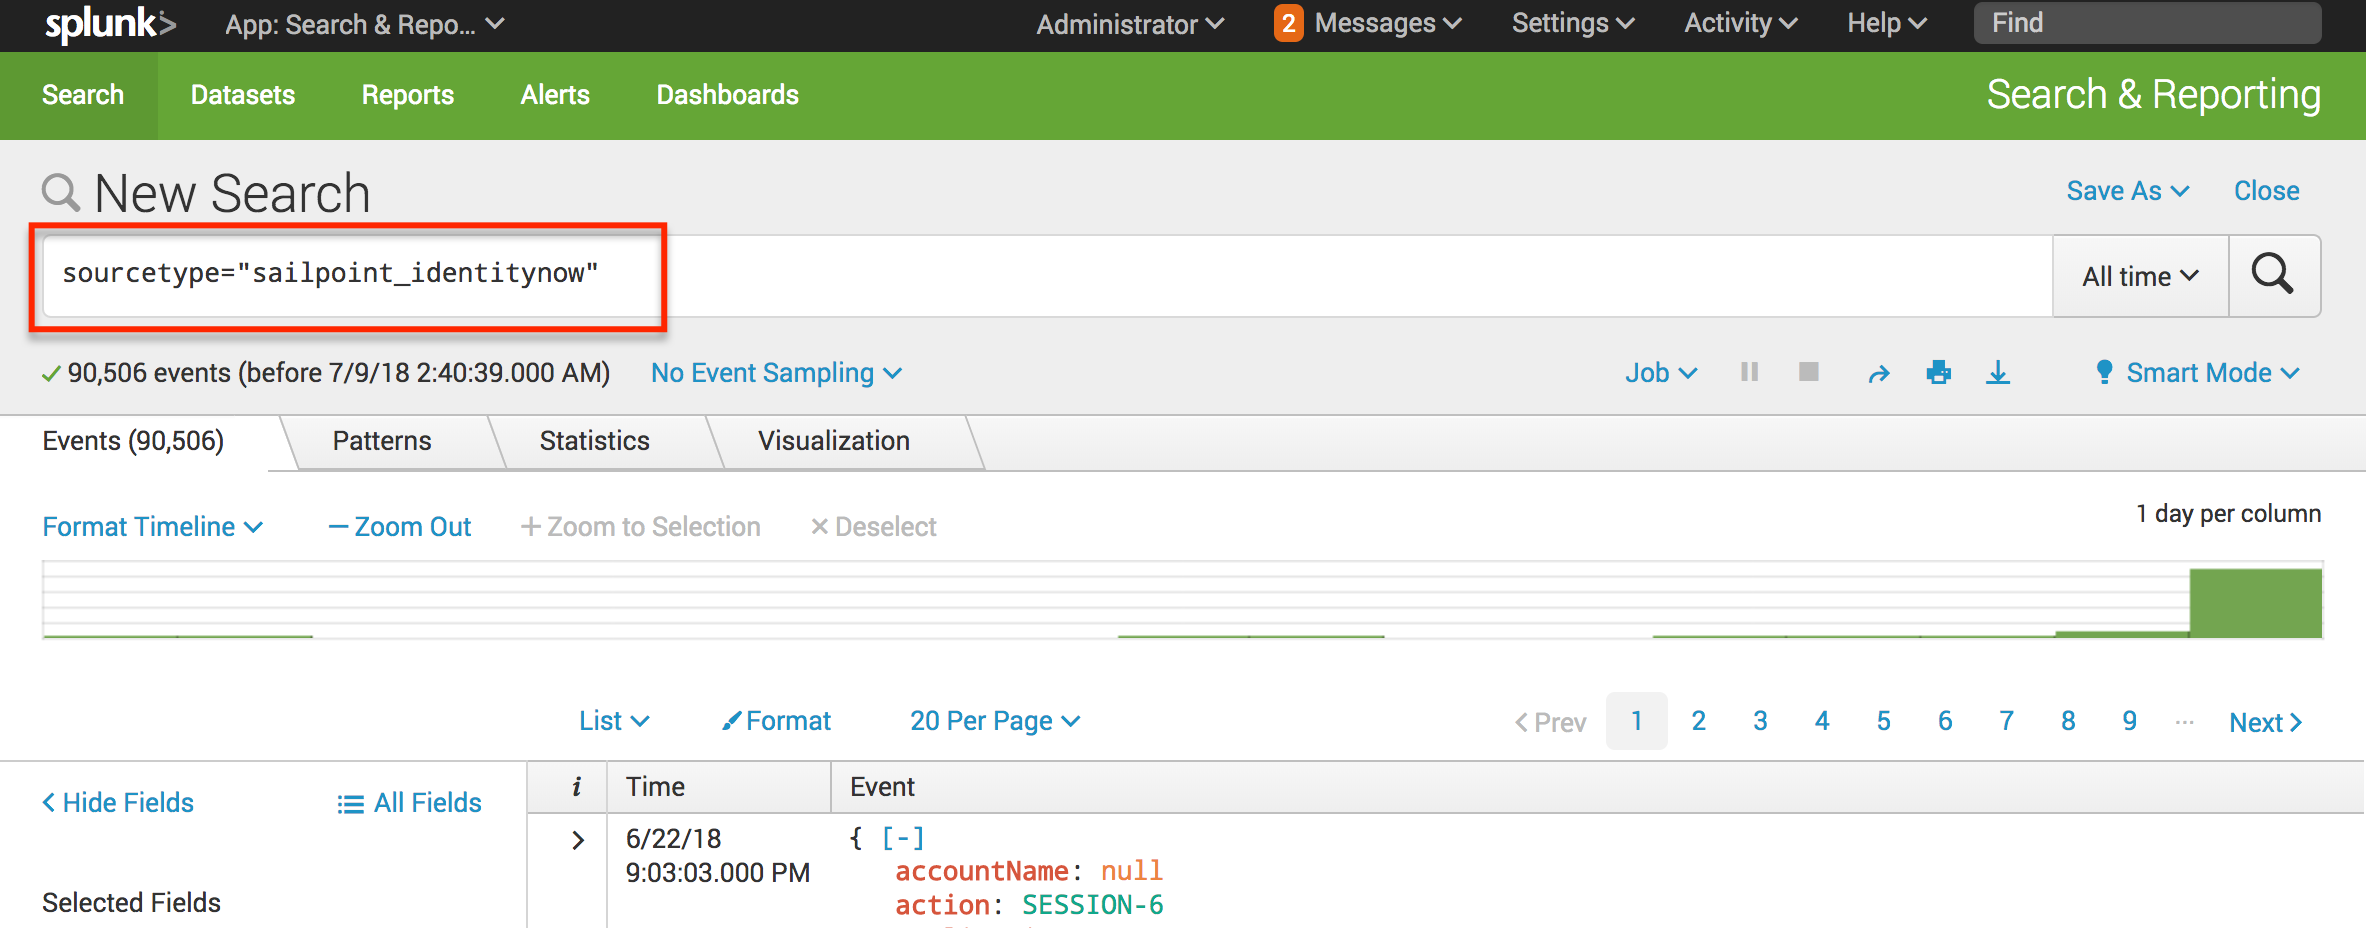
Once the add-on has been installed, and a new data input has been created, it is time to start searching. A simple way to test this, is from the Splunk Search and Reporting app, type sourcetype="sailpoint_identitynow". If everything has been configured correctly, this should start returning results.
NOTE: As of version 2.0.0 of the add-on, the add-on operates on a 60 minute delay to ensure that new AuditEvents are available to the IdentityNow Search API.
NOTE: As of version 2.0.0, if the Splunk add-on loses its connection to Identity Security Cloud (manually disabled, credentials are removed, etc) for longer than a 24 hour period, it will begin collecting events from the time of reactivation/reconnection. For administrators, this means that if the add-on collection is suspended longer than 24 hours, audit events for this time period will not be available in Splunk. These events will still be retrievable via the IdentityNow API's.
Advanced Search
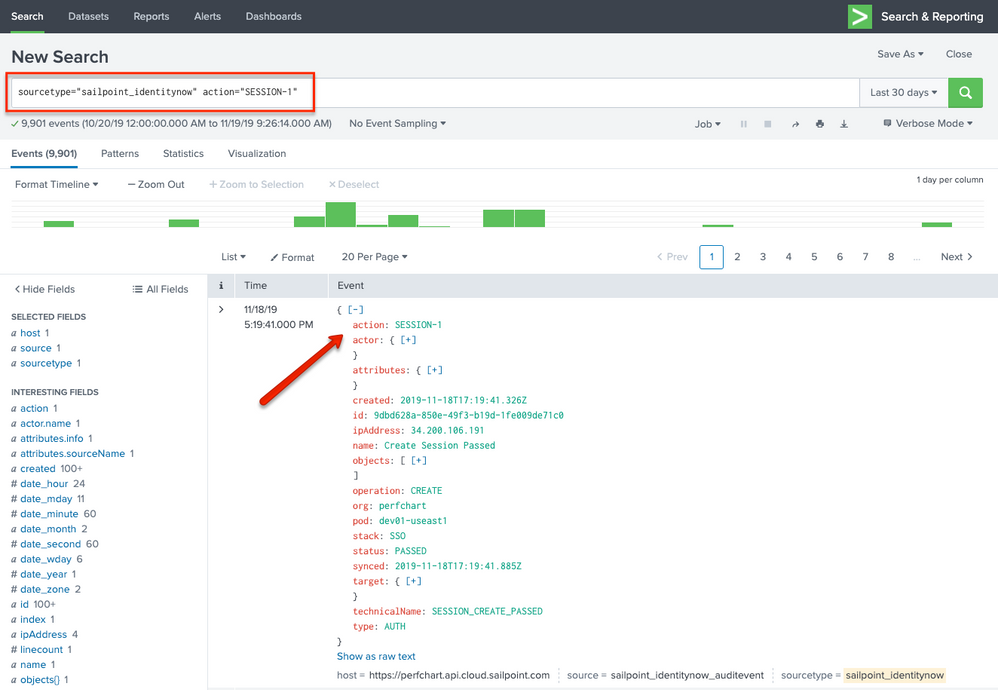
Advanced searches can be performed by specifying one of the many fields present in an Identity Security Cloud AuditEvent object. The below example shows a search that specifies the action "SESSION-1", which when translated, would mean show me all the audit events that indicate a user session being created (user login to Identity Security Cloud).
Dashboard
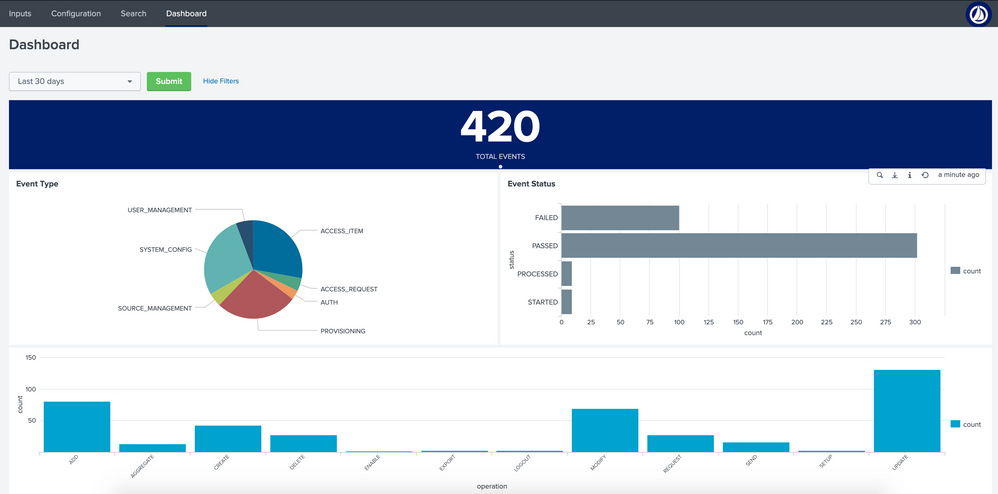
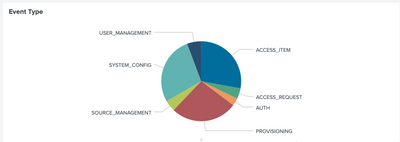
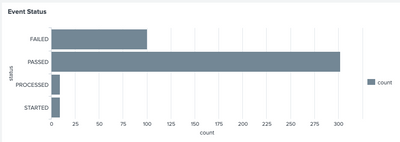
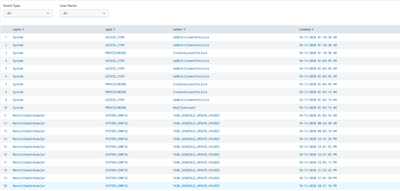
The SailPoint Identity Security Cloud AuditEvent Add-on for Splunk provides a source types with in Splunk®. The above configured source type will be are used to collect Audit events from Identity Security Cloud. Users can configure this source type to collect events to Splunk® and populate a custom dashboard visualizing different types and details for these events.
Initial Dashboard before configuring the source type
- The Dashboard displays data in different visualization format.
- Dashboard data is updated every 5 minutes.
- The time picker is set to last 30 days by default.
- Time window can be modified, and the dashboard results update automatically by clicking “Submit” button.
- The dynamic selectable filters help to get filtered results. Filtration updates the data on the dashboard.
- Each visualization is linked to search.
- Pie chart shows the Error Type. On hover shows the percentage and count for the slice.
- The bar chart displays the count for event status on top of each column. X-axis displays the count and Y-axis shows the status.
- The bar chart displays the count for type of operations. X-axis shows each operation t and Y-axis shows the count.
- Table below shows events received from the source type. It consists of paginator and column sorting functionality.
Index Setting:
If index is set to anything other than default, please edit the script "input_module_sailpoint_identity_security_cloud_auditevent.py" and set index=helper.get_output_index() in the below code:
event = helper.new_event(data=data, time=None, host=tenant["url"], index=None, source=helper.get_input_type(), sourcetype=helper.get_sourcetype(), done=True, unbroken=True)
Related Links
- Identity Security Cloud API reference - SailPoint Identity Security Cloud API
- Identity Security Cloud API authentication guide - Best Practices IdentityNow REST API Authentication
- Identity Security Cloud Personal Access Tokens - Best Practice: Using Personal Access Tokens in Identity Security Cloud
- Splunk 'Splexicon' terminology guide - Splexicon - Splunk Documentation
- Splunk 'Search' guide - Get started with Search - Splunk Documentation
Version 2 Updates - 12/2/2019
Version 2.0.0 of the SailPoint Identity Security Cloud AuditEvent Add-on for Splunk contains several enhancements:
- Utilizes the new Identity Security Cloud /search API's
- Limited look-back (24 hours) to improve performance
- 60-minute staggered ingestion of AuditEvents
- Modified format of AuditEvent data
- Additional authentication configuration fields
1/15/2020
Version 2.0.1+ of the SailPoint Identity Security Cloud AuditEvent Add-on for Splunk contains a change to the the authentication flow:
- Utilizes Personal Access Token information
10/14/2020
Version 2.0.3 of the SailPoint Identity Security Cloud AuditEvent Add-on for Splunk contains a custom dashboard visualizing different types and details for these events.
01/08/2021
Version 2.0.4
04/12/2021
Version 2.0.5: Bug fix related to proxy settings.
04/27/2021
Version 2.0.6: Fixed reported cloud-vetting issues.
10/06/2021
Version 2.0.7: Compatible with JQuery v3.5 and above.
11/04/2021
Version 2.0.8: Added missing .xml files for input and configuration.
03/24/2021
Version 2.0.9: Updated /search Beta API to V3 API
08/17/2023
Version 2.0.10: Updated the add-on to be fully compatible with Python 3.7 and Splunk Cloud.
11/09/2023
Version 2.0.12: Updated the addon to utilize x-www-form-urlencoded and pass the client secret and client id in the request body for OAuth2 authentication.
06/27/2024
Version 2.0.13: Updated the add-on to be fully compatible Splunk Cloud.
08/23/2024
Version 2.0.14: Minor bug fix.
10/25/2024
Version 2.0.15:
-Minor bug fix.
-Add-on updated to be compatible with Splunk Cloud.
02/07/2025
Version 2.0.16:
-Add-on updated to be compatible with Splunk Cloud.
- Mark as Read
- Mark as New
- Bookmark
- Permalink
- Report Content to Moderator
https://community.sailpoint.com/t5/IdentityNow-Wiki/Best-Practices-Creating-an-IdentityNow-Password-... This link is not present. Can you please update the correct link?
- Mark as Read
- Mark as New
- Bookmark
- Permalink
- Report Content to Moderator
This document says about creating the personal token using the client credentials. But when I try to create the personal token using the client credential, I get I "access_denied" error. How do I create the personal token without attaching it to any identity?
- Mark as Read
- Mark as New
- Bookmark
- Permalink
- Report Content to Moderator
Good afternoon Prajna - the PAT creation process requires a user context (attaching to an Identity). For more information, please see: https://community.sailpoint.com/t5/IdentityNow-Wiki/Best-Practice-Using-Personal-Access-Tokens-in-Id...
- Mark as Read
- Mark as New
- Bookmark
- Permalink
- Report Content to Moderator
Hi @adam_creaney ,
Thank you for updating the document.
- Mark as Read
- Mark as New
- Bookmark
- Permalink
- Report Content to Moderator
Hello !
I've used the code from the Splunk connector to create a script to fetch the events using the AuditEvent API.
This yields a lot of items with a lot of different "action", "type", "attributes", "status" values, etc. Is there somewhere a list of the items that one may get from this API, and their meaning, in each case? This would be extremely useful and I couldn't find it on the API documentation.
Thanks a lot!
Robin
- Mark as Read
- Mark as New
- Bookmark
- Permalink
- Report Content to Moderator
Hello!
I have integrated the Splunk with IDN, and found out only a few event logs the Splunk could receive. For example, I created source and uploaded delimited file these days but Splunk could not receive these types of events. May I know is it normal that the Splunk will not be able to receive these event logs?
- Mark as Read
- Mark as New
- Bookmark
- Permalink
- Report Content to Moderator
I am using Splunk Cloud, we attempted to have this add-on added to our Splunk Cloud instance but Splunk responded to us with the notice below.
According to my Splunk Admin, our Splunk Cloud instance does not have access to the App Browser and instead requires us to have Splunk support install modules for us.
Any help that can be offered on how we can get this working?
This is a preliminary report. More issues may be found upon further review.
Thank you for your app install request. Your app did not meet security and functionality requirements for Splunk Cloud for the following reasons:
- When using addon-builder to build an app, if a secret is part of the input schema, it will be properly encrypted and stored when operating inside the app. However, when editing an input using the system user interface(settings->data input-><input name>) with existing inputs disabled, the secrets will be stored in plain text. To avoid this secret disclosure, you can either make the secret field a global parameter(seehttps://docs.splunk.com/Documentation/AddonBuilder/2.2.0/UserGuide/ConfigureDataCollectionAdvanced) if there is only one secret for all the modular inputs, or you can add the secret/apikey/access_token field to the global account if there is a need to store multiple api keys. File: Line Number: 1
- Mark as Read
- Mark as New
- Bookmark
- Permalink
- Report Content to Moderator
What are the minimum account privileges for the Splunk Personal Access token? Can one be generated that is not a full administrator since it is performing read-only activities?
- Mark as Read
- Mark as New
- Bookmark
- Permalink
- Report Content to Moderator
Splunk recently released Add-on Builder v4.0.0. If you built your Splunkbase solution with a prior release of Add-on Builder, please update your app(s) as soon as possible, and no later than August 31, 2021, using this latest version so that your Splunkbase app(s) will be compatible with the next major releases of Splunk Cloud Platform and Splunk Enterprise.
As we move to newer versions of Python and jQuery in the platform, we have updated Add-on Builder to support them. That means that the current release of your application(s) based on the prior Add-on Builder release will not be compatible with the new Splunk releases coming later this year.
You can find more information about this latest Add-On Builder release in the Splunk Add-on Builder Use Guide. To update your add-on, you will need to export your current project, then import it into this new Add-on Builder release. You can find more information in the “Import and export an add-on project” section of the user guide.
If you have any questions, please reach out to us in the Splunk Community.
Thanks in advance for your support.
Team Splunk
- Mark as Read
- Mark as New
- Bookmark
- Permalink
- Report Content to Moderator
I noticed that the Splunk documentation on this site says that this should support multiple environment(s) - looking at the code in the python scripts though it looks like it doesn't?
After reviewing the Splunk Plugin code (the Python code which Splunk uses to read data from SailPoint), I noticed the following bits of information:
Splunk/etc/apps/Splunk_TA_sailpoint/bin/input_module_sailpoint_identityiq_auditevents.py – this is the file in question that caught my attention.
The way the code appears to operate is that it defines a SINGLE file for where it stores the epoch date following the logic outlined below:

1)  Initially there is file check (audit_events_checkpoint.txt) to see if the file exists
2)  If Python doesn’t find it attempts to created it
3)  If it fails again it creates the folder structure and then add the file
4)  After the first three steps Python opens the file
5)  Python then reads the files and pull the first value in (the Unix/Epoch time stamp)
6)  It then uses this as part of its query outbound.

#Read the timestamp from the checkpoint file, and create the checkpoint file if necessary
    #The checkpoint file contains the epoch datetime of the 'created' date of the last event seen in the previous execution of the script.
    checkpoint_file = os.path.join(os.environ['SPLUNK_HOME'], 'etc', 'apps', 'Splunk_TA_sailpoint', 'tmp', "audit_events_checkpoint.txt")
    try:
        file = open(checkpoint_file, 'r')
    except IOError:
        try:
            file = open(checkpoint_file, 'w')
        except IOError:
            os.makedirs(os.path.dirname(checkpoint_file))
            file = open(checkpoint_file, 'w')

    with open(checkpoint_file, 'r') as f:
         checkpoint_time = f.readlines()

    #current epoch time in milliseconds
    # new_checkpoint_time = int((datetime.datetime.utcnow() - datetime.datetime(1970, 1, 1)).total_seconds() *1000)

    if len(checkpoint_time) == 1:
        checkpoint_time =int(checkpoint_time[0])
    else:
        checkpoint_time = 1562055000000
        helper.log_info("No checkpoint time available. Setting it to default value.")

    #Standard query params, checkpoint_time value is set from what was saved in the checkpoint file
    queryparams= {
         "startTime" : checkpoint_time,
         "startIndex" : 1,
         "count" : 100
    }

1)  Jumping down to the next references we find that the JSON object that is pulled in is used to create the new timestamp that the system will use on the next request.
2)  It then takes this value and writes it to file which it will reuse the next time a call is made.

#Iterate the audit events array and create Splunk events for each one
    invalid_response = isListEmpty(auditEvents)
    if not invalid_response:
        for auditEvent in auditEvents:

            data = json.dumps(auditEvent)
            event = helper.new_event(data=data, time=None, host=None, index=helper.get_output_index(), source=helper.get_input_type(), sourcetype=helper.get_sourcetype(), done=True, unbroken=True)
            ew.write_event(event)

        #Get the created date of the last audit event in the run and save it as a checkpoint key in the checkpoint file
        list_of_created_date = extract_element_from_json(results, ["auditEvents", "created"])

        new_checkpoint_created_date = list_of_created_date[-1]
        helper.log_info("DEBUG New checkpoint date \n{}".format(new_checkpoint_created_date))

    #Write new checkpoint key to the checkpoint file
        with open(checkpoint_file, 'r+') as f:
            f.seek(0)
            f.write(str(new_checkpoint_created_date))
f.truncate()- Mark as Read
- Mark as New
- Bookmark
- Permalink
- Report Content to Moderator
What is the recommended approach to source the VA's logs into Splunk?
- Mark as Read
- Mark as New
- Bookmark
- Permalink
- Report Content to Moderator
Same issue as @robertm here. Despite configuring for two inputs we only get logs from the original IDN environment that was configured.
- Mark as Read
- Mark as New
- Bookmark
- Permalink
- Report Content to Moderator
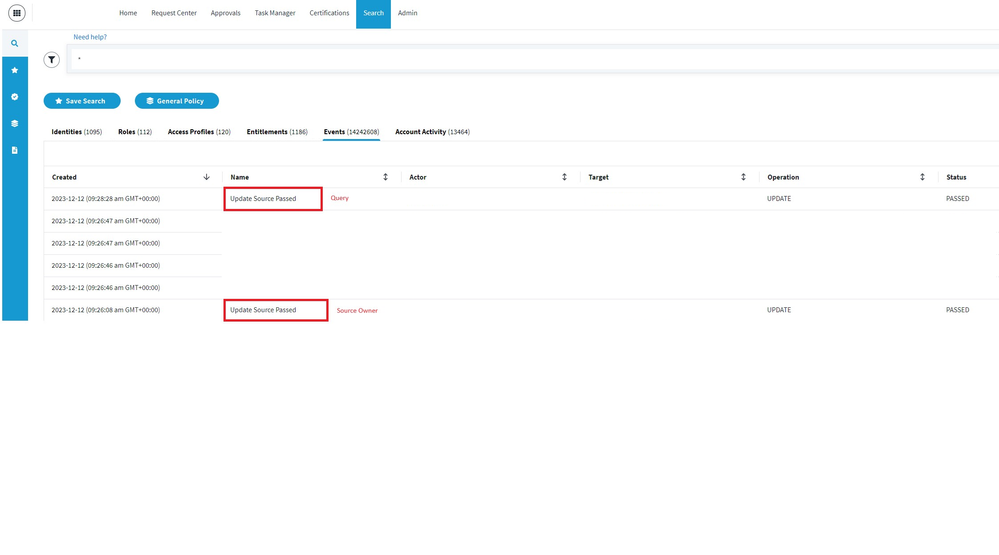
Question, does anyone know if the splunk provides more details then what the Sailpoint audit logs show. So for example if someone changes the Source Config Query, or Source Config, will it says what has been changed at that level of detail, or will it just show the same, like my sample screenshot below.
- Mark as Read
- Mark as New
- Bookmark
- Permalink
- Report Content to Moderator
Hello @adam_creaney,
We configured Addon and create inputs on splunk entreprise and we do not receive any data when perform searching.
We have following message in log :
2024-08-01 15:24:01,387 INFO pid=29020 tid=MainThread file=base_modinput.py:log_info:295 | checkpoint_time 2024\-08\-01T12\:17\:57\.054Z search_delay_time 2024\-08\-01T12\:24\:01\.387134Z
2024-08-01 15:24:01,387 INFO pid=29020 tid=MainThread file=base_modinput.py:log_info:295 | INFO IdentityNow URL is HTTPS.
2024-08-01 15:24:01,534 DEBUG pid=29020 tid=MainThread file=connectionpool.py:_make_request:474 | https://tenant.api.identitynow.com:443 "POST /v3/search/events?count=true&offset=0&limit=10000 HTTP/1.1" 200 None
We can see that the plugin use POST /v3/search/events?count=true&offset=0&limit=10000 , can you confirm if that endpoint exist ?
- Mark as Read
- Mark as New
- Bookmark
- Permalink
- Report Content to Moderator
Also have this error
Uncaught exception in Aggregator, skipping an event: Can't open DateParser XML configuration file "datetime.xml": Le fichier spécifié est introuvable. - data_source="sailpoint_identitynow_auditevent://Sailpoint_DEV"
- Mark as Read
- Mark as New
- Bookmark
- Permalink
- Report Content to Moderator
Seeing the same error as @baoussounda. Is there a fix or workaround?
- Mark as Read
- Mark as New
- Bookmark
- Permalink
- Report Content to Moderator
@etipton After long hours of debugging i found a work around that i post here Splunk ISC Addon for audit - Identity Security Cloud (ISC) / ISC Discussion and Questions - SailPoin...
- Mark as Read
- Mark as New
- Bookmark
- Permalink
- Report Content to Moderator
Thanks @baoussounda - that is very helpful. Unfortunately we are on the cloud version of Splunk so we can't perform thew workaround.
@dhara_shah, I see that you updated this article on 6/27 - perhaps you can put me in touch with the right person to get this resolved? I have reached out to Splunk support and they indicated that Sailpoint would need to update the add-on.
- Mark as Read
- Mark as New
- Bookmark
- Permalink
- Report Content to Moderator
@etipton : I have replied to you via support ticket.Thank you for reaching out.
- Mark as Read
- Mark as New
- Bookmark
- Permalink
- Report Content to Moderator
@adam_creaney , @dhara_shah is possible to modify the default dashboard ?
- Mark as Read
- Mark as New
- Bookmark
- Permalink
- Report Content to Moderator
@baoussounda : At this point, it is not possible to modify default dashboard.
Thank you,
Dhara Shah
- Mark as Read
- Mark as New
- Bookmark
- Permalink
- Report Content to Moderator
I am testing with version 2.0.15. And assume the api URL to be
identitynow_url = 'https://{}.api.identitynow.com'.format(org_name)
where the org_name is the Organization name in the add-on setting.
Although this does not cater for demo tenant (at least mine) which use {org_nam}api.identitynow-demo.com.
Possible enhancement?
- Mark as Read
- Mark as New
- Bookmark
- Permalink
- Report Content to Moderator
Echoing @smithi1524's comment but for FedRAMP tenants i.e. {org_name}.api.saas.sailpointfedramp.com.

