- Products & services Products & services
- Resources ResourcesLearning
- Learning
- Identity University Get technical training to ensure a successful implementation
- SailPoint professional certifications & credentials Advance your career or validate your identity security knowledge
- SailPoint recertification program Get recertified by demonstrating ongoing learning
- Training onboarding guide Make of the most of training with our step-by-step guide
- Training FAQs Find answers to common training questions
- Community Community
- Compass
- :
- Discuss
- :
- Community Wiki
- :
- IdentityIQ Wiki
- :
- Task completion rules and task metrics
- Article History
- Subscribe to RSS Feed
- Mark as New
- Mark as Read
- Bookmark
- Subscribe
- Printer Friendly Page
- Report Content to Moderator
Task completion rules and task metrics
Task completion rules and task metrics
In IdentityIQ, a task completion rule is an optional rule that runs at the end of a task.
It may be used for a variety of purposes, such as saving task statistics in a time-series database for subsequent monitoring, analysis, and visualization using other tools.
Influx and Prometheus are popular time-series databases that are well suited for storing task metrics.
Attached is an example task completion rule that sends metrics to Influx.
It sends each of the numeric attributes in the task result as a measurement value. Note: You do not need to define these attributes in the database beforehand, as Influx is schema-less.
Once you've collected some data, Grafana is an easy to use tool for visualizing it in a dashboard.
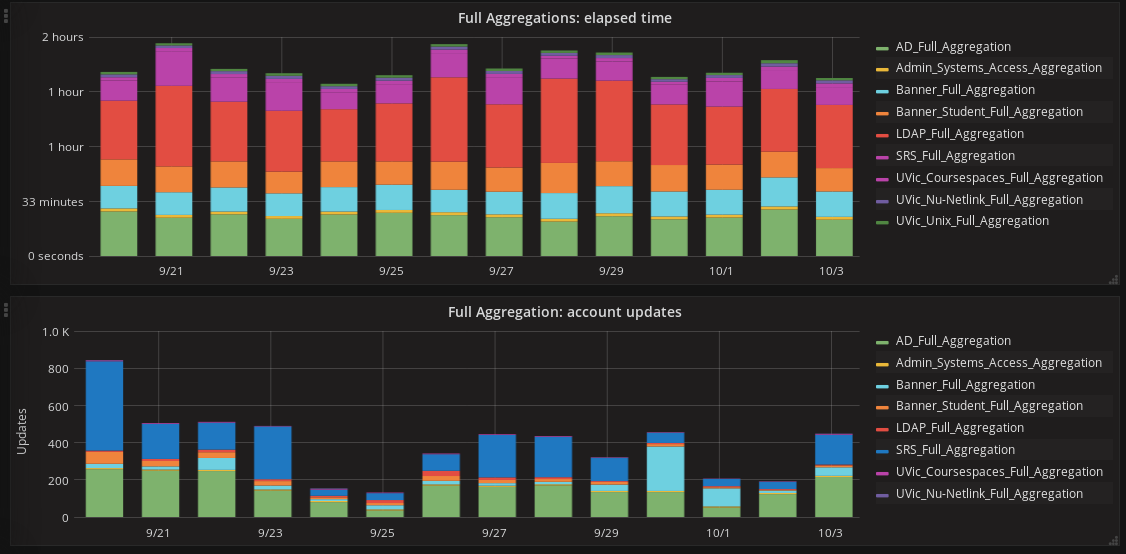
The example graphs below show statistics for full aggregation tasks over a 14 day period. The first graph shows how long the aggregations took, the second graph shows how many account changes were detected.
To use the rule for Influx:
- Download, install and configure Influx.
- Modify the "Task Completion Influx Statistics" rule with the URL for your Influx database, and import the rule.
- Edit your System Configuration object to enable the rule:
<entry key="taskCompletionRule" value="Task Completion Influx Statistics"/>
Prometheus is a bit more work to configure, but I can provide example code for it if there is interest.
- Mark as Read
- Mark as New
- Bookmark
- Permalink
- Report Content to Moderator
paul.hilchey
Hi,
How did you configure above GRAFANA dashboard to show each aggregation task details over certain time period ?
Thanks,
Pooja
- Mark as Read
- Mark as New
- Bookmark
- Permalink
- Report Content to Moderator
Hi Pooja,
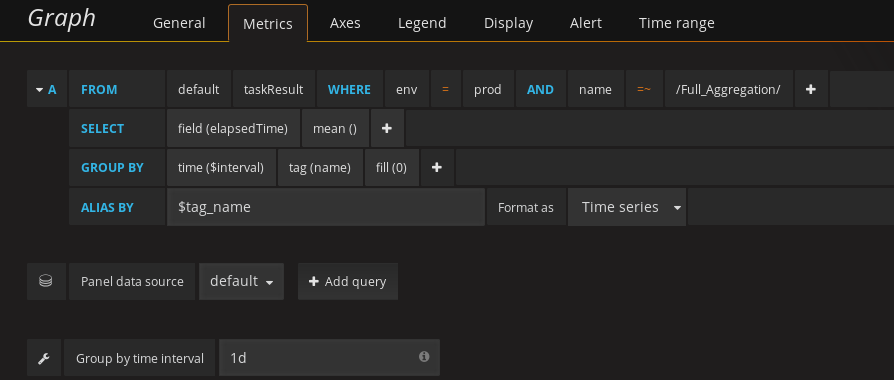
I'll attach a screenshot showing the Grafana settings for the elapsed time graph. Note that the "where" clause selects tasks in our "prod" environment, that have a name matching the pattern "/Full_Aggregation/". You will likely need to change those to match your deployment.
Other settings you should specify:
- the Y axis units of "duration (s)"
- display draw mode "Bars", with "Stack" enabled
- time range: 21d
The time range setting is important: you'll get an error message "Datapoints outside time range" if the range is too small.
- Mark as Read
- Mark as New
- Bookmark
- Permalink
- Report Content to Moderator
Paul,
I would be interested in seeing the code for the Prometheus integration.
Anthony
